
What drives IPv6 deployment? [Archived]
OUT OF DATE?
Here in the Vault, information is published in its final form and then not changed or updated. As a result, some content, specifically links to other pages and other references, may be out-of-date or no longer available.
It’s been almost seven years since World IPv6 Launch day on 6 June 2011. In those seven years, we’ve managed to place ever-increasing pressure on the dwindling pools of available IPv4 addresses, but we have still been unable to complete the transition to an all-IPv6 Internet.
Nobody predicted this situation when we first thought about the consequences of running out of IPv4 addresses. We all thought that the depletion of IPv4 addresses would, in a continuously expanding Internet, provide sufficient rationale for IPv6.
We have been proved right that growth of the Internet has been inexorable. Personal computers have jumped from the desk to our pockets and then leapt across to a world of managed devices. A census of the Internet’s connected devices would readily number in the tens of billions of devices. If they all needed a globally unique permanent IP address, IPv6 would’ve been an imperative over a decade ago. But that simply has not happened.
Instead, we’ve managed to completely redesign the architecture of the Internet.
Some might suggest we have undertaken this effort simply to avoid the transition to IPv6. Perhaps that’s a bit of an extreme view but the picture of IPv6 today is certainly puzzling. What’s going on?
Data can help answer this question, and at APNIC, we’ve been performing a large-scale Internet-wide measurement of the level of adoption of IPv6 since late 2011.
I won’t repeat the details of the measurement system here, but you can watch a presentation I gave at APNIC 44 describing the way we undertake this measurement.
At APNIC, we operate the measurement system using a sample rate of between 6 to 10 million endpoints per day, drawn from across most of the deployed Internet. We are able to analyze this data to produce a time series of IPv6 adoption.
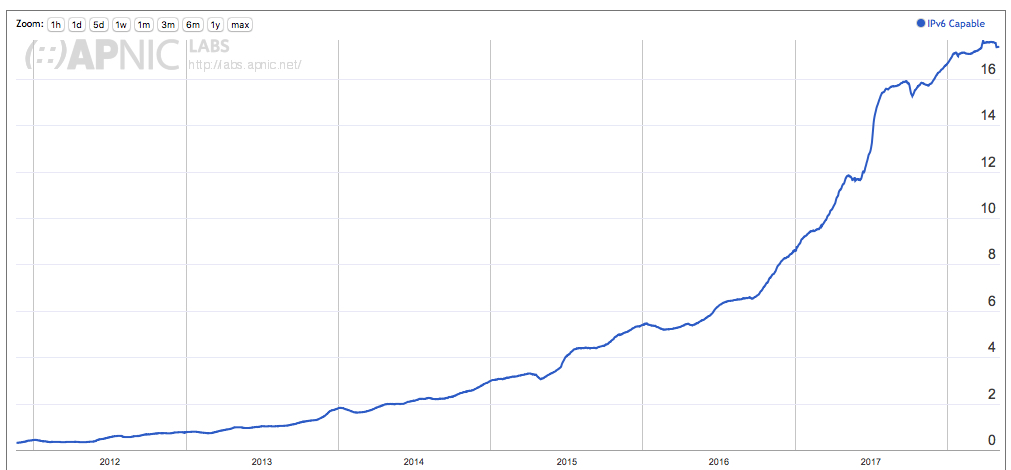
Figure 1 – User adoption of IPv6 since late 2011 (percentage of total user population).
When these measurements commenced in late 2011 there was very little in the way of IPv6 deployment, and the total deployment level was measured at 0.3% of the Internet user base at the time (that is, an average of 1 in 300 users could successfully use IPv6 to access a web object).
World IPv6 Launch day on 6 June 2011 saw the rate of IPv6 adoption rise from 0.4% to 0.8% on the day, but the long-term IPv6 adoption rate was still very slow. It was not until mid-2013 that we saw the Internet-wide IPv6 adoption rise above 1%.
A major change in the IPv6 deployment picture occurred over the two-and-a-half-year period from the start of 2015 to mid-2017. Over that period the level of IPv6 adoption rose from 3% to 15%, and the majority of that rise occurred in the first half of 2017. By the end of 2017, the level of IPv6 deployment was measured at some 18% of the Internet, but there has been no significant further movement in that number across the first four months of 2018. Just four months is probably an insufficient period to justify an assertion that IPv6 deployment has stalled, but the hiatus in the growth of the use of IPv6 is certainly a source of some concern (Figure 2).
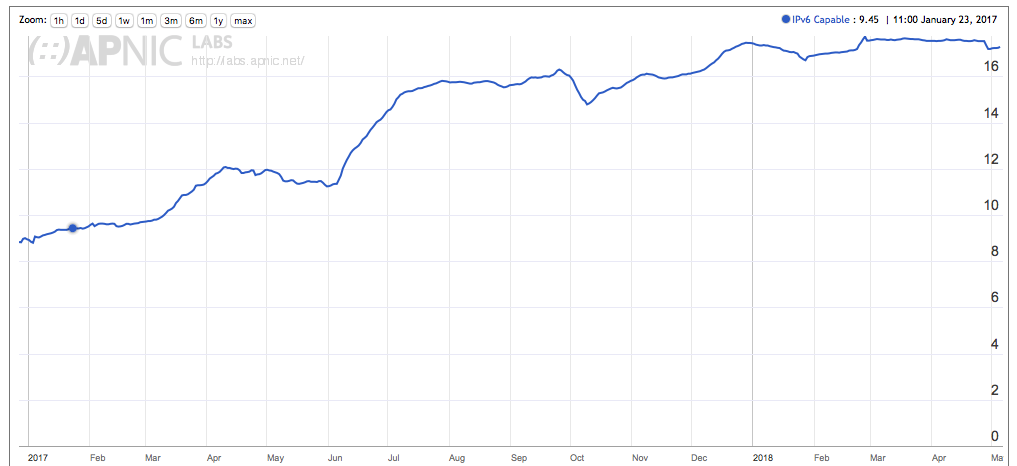
Figure 2 – User adoption of IPv6 (2017 to mid-2018).
Can we determine what factors might lie behind this recent slowdown in the growth of IPv6? Perhaps some pointers to an answer to this question lie in an examination of the opposite question. What are the common factors that have been behind the deployment of IPv6 in networks so far?
In this article, I’d like to look at some potential answers to this question and see if the accumulated data can support any of these theories.
Who uses the IPv6 Internet?
To start with it might be instructive to look at the Internet itself; in particular look at the national populations of Internet users. Where are the Internet’s users?
One resource I’ve been using is Internet Live Stats, which provides an estimate of the total population of Internet users per economy.
Today the five largest national pools of Internet users are in China, India, the United States, Brazil and Japan. Together, these five economies account for slightly more than one half of the entire current estimate of some 3.4 billion Internet users.
In terms of IPv6 adoption, it follows that if all of these five economies undertook a close to ubiquitous deployment of IPv6 they would be able to swing the IPv6 adoption measurement point to over one-half of all users. Obviously, this is yet to happen and the actual picture of IPv6 deployment is somewhat different. The most overt missing element at this national level, in this set of the five largest national Internet user pools, is China, where visible IPv6 deployment is yet to lift above relatively small levels of adoption.
If these existing IPv6 users are not in China, then where are they?
Of the estimated 513 million IPv6 users, let’s look at the subset of economies where the national IPv6 user population is at least 3 million, or more than 1% of the total IPv6 user population (Table 1).
Country
IPv6 Users
% of Total World Count
% of National Users
India
242M
44%
52%
USA
117M
21%
40%
Germany
30M
6%
42%
Brazil
30M
6%
21%
Japan
28M
5%
24%
UK
17M
3%
27%
France
12M
2%
21%
Canada
7M
1%
20%
Belgium
6M
1%
58%
Malaysia
5M
1%
22%
Rep. of Korea
5M
1%
11%
Vietnam
4M
1%
8%
Australia
3M
1%
16%
Table 1 – IPv6 users per economy.
The economy with the highest IPv6 adoption level is Belgium. Other countries which high IPv6 deployment levels do not have a large population of Internet users in absolute terms, so missing from Table 1 are Greece (37%), Switzerland (34%), Luxembourg (33%) Uruguay (32%) and Portugal (25%).
This table might also suggest that within each economy the distribution of IPv6 users is uniform across all national ISPs. This is definitely not the case, and to sharpen our focus in looking at where IPv6 is deployed, we need to look at each Internet Service Provider (ISP) — Table 2 shows the 20 ISPs with the largest estimated IPv6 user populations.
Rank
AS
AS Name
CC
Users (est)
V6 Users (est)
V6%
1
AS55836
Reliance Jio
IN
257,116,163
236,669,761
92%
2
AS7922
Comcast Cable
US
48,845,229
35,701,856
73%
3
AS7018
ATT Services
US
27,190,530
21,621,772
80%
4
AS38266
Vodafone Essar Ltd.
IN
42,711,918
17,068,044
40%
5
AS22394
Verizon Wireless
US
18,499,350
15,788,328
85%
6
AS45271
Idea Cellular
IN
38,817,216
15,470,268
40%
7
AS21928
T-Mobile USA
US
15,402,964
14,513,144
94%
8
AS3320
Deutsche Telekom ISP
DE
23,392,392
14,118,853
60%
9
AS5607
BSKYB Broadband
GB
13,714,642
12,821,973
93%
10
AS2516
KDDI
JP
22,146,612
11,725,651
53%
11
AS28573
CLARO
BR
24,184,316
11,048,081
46%
12
AS17676
Softbank BB
JP
25,292,851
8,259,099
33%
13
AS3215
Orange
FR
16,990,645
7,976,416
47%
14
AS20057
ATT Mobility
US
14,455,761
7,967,862
55%
15
AS22773
Cox Communications
US
11,537,814
6,224,326
54%
16
AS18881
Telfonica Brasil
BR
14,125,727
5,844,652
41%
17
AS10507
Sprint PCS
US
7,548,658
5,797,873
77%
18
AS9644
SK Telecom
KR
6,912,564
5,654,940
82%
19
AS4713
OCN NTT
JP
19,995,028
5,586,165
28%
20
AS31334
KabelDeutschland
DE
7,456,144
5,340,966
72%
Table 2 – IPv6 users per ISP.
Three surprising numbers in this table are those of 94% adoption in T-Mobile USA, 93% in BSkyB and 92% in Reliance Jio. They are surprising in that prior to these deployments we had thought that an ISP deployment of IPv6 was only a part of the story; it was up to the connected user network to also use IPv6-capable equipment within their edge network.
The Comcast deployment level of 73% reflects this, in that while the ISP network is fully deployed with IPv6 support, there is still IPv4-only customer equipment in use. Upgrading equipment in the home or office takes time, and the 73% adoption level reflects this.
So why can these three networks achieve significantly higher levels of IPv6 adoption? I suspect that this is a reflection of the difference between mobile ISPs and fixed infrastructure of mixed ISPs, and even the dual stack technology used by the mobile ISP. For example, T-Mobile USA uses 464XLAT, where the communications system is an IPv6-only network, and all attached devices use IPv6 to connect to the network. IPv4 is a tunnelled addition, where the IPv4 module is found in the user device. When given the choice these devices have a very strong affinity to use IPv6 over IPv4. It would not be surprising to learn that a similar approach was taken in Reliance Jio and BSkyB.
However, these three ISPs are somewhat anomalous within the larger picture of per-ISP deployment, and it is more common to observe that within an ISP, IPv6 is not ubiquitously used by customer equipment. Within these 20 ISPs with the largest numbers of IPv6 users, we see a variation of IPv6 penetration between a low of 28% deployment (NTT in Japan) to 94% (T-Mobile USA). It is likely that the lower numbers reflect an ISP that has integrated a number of different consumer products into a single AS, and only some of the products have integrated IPv6 support as yet, or the numbers reflect a combination of customer equipment capability overlaid on the ISP’s network IPv6 capabilities.
The basic observation is that IPv6 deployment is by no means uniform and deployment levels are variable within an individual economy and even within an individual ISP. The question now is: Are there common factors behind these IPv6 deployments?
Theories of IPv6 deployment
Let’s look at the available data about the Internet, its users, and ISPs to see if there is some visible correlation between IPv6 deployment in the ISP and some other factor that we can measure. What we are looking for here is some evidence that IPv6 deployment and some factors are closely related.
‘IPv6 is only for the rich’
It’s not strictly necessary for an ISP to deploy IPv6 in order to provide a consumer Internet access product. There are apparently no significant services that are accessible only using IPv6, and as long as an ISP has sufficient public IPv4 addresses to service the activities of its customer base, then it is not forced to deploy IPv6. From this admittedly very limited perspective, the case could be made that IPv6 is a ‘luxury’ activity, as distinct from an ‘essential’ activity.
But is this the case? Is IPv6 an activity that is undertaken only by those ISPs who can afford to undertake an activity that is not strictly speaking absolutely required? Or, to put it more bluntly, is IPv6 only for the rich ISPs?
One way to measure the ‘wealth’ of an ISP is to look at the aggregate net wealth of its customer base. Using the current Gross Domestic Product (GDP) of each national economy, and the current national population estimates we can derive a GDP per capita for each economy. We can then use the estimate of the customer size of each ISP to derive a notional ‘wealth’ value by multiplying this customer size by the GDP per capita. The 20 ‘richest’ ISPs using this method are shown in Table 3.
The IPv6 deployment figures from these 20 ISPs show a range of IPv6 uptake from 0% through to 94%. Some 13 of these 20 ISPs have an IPv6 deployment above 35%. While three of the low-level IPv6 use ISPs are Chinese, there are also Korean, US, and UK ISPs in a similar position. The suggestion that IPv6 is only adopted by ‘richer’ ISPs is looking like a somewhat tenuous proposition these days.
Rank
AS
AS Name
CC
Users (est)
Value (est)
IPv6 Users
IPv6%
1
AS7922
Comcast Cable
US
48,845,229
2,783,982,672,084
35,701,856
73%
2
AS4134
ChinaNet
CN
310,853,595
2,460,095,350,830
244,673
0%
3
AS7018
ATT Services
US
27,190,530
1,549,751,447,880
21,621,772
80%
4
AS4837
China Unicom
CN
161,782,709
1,280,348,359,026
109,825
0%
5
AS22394
Verizon Wireless
US
18,499,350
1,054,388,952,600
15,788,328
85%
6
AS3320
Deutsche Telekom
DE
23,392,392
988,562,485,920
14,118,853
60%
7
AS17676
Softbank BB
JP
25,292,851
984,220,710,963
8,259,099
33%
8
AS21928
T-Mobile USA
US
15,402,964
877,907,336,144
14,513,144
94%
9
AS2516
KDDI
JP
22,146,612
861,791,112,756
11,725,651
53%
10
AS20115
Charter Comms
US
14,901,389
849,319,567,444
1,528,640
10%
11
AS20057
ATT Mobility
US
14,455,761
823,920,553,956
7,967,862
55%
12
AS4713
OCN NTT
JP
19,995,028
778,066,524,564
5,586,165
28%
13
AS22773
Cox Communications
US
11,537,814
657,609,246,744
6,224,326
54%
14
AS3215
Orange
FR
16,990,645
642,144,437,130
7,976,416
47%
15
AS701
Verizon Business
US
11,056,076
630,152,107,696
62,472
1%
16
AS209
CenturyLink
US
9,668,638
551,073,691,448
24,719
0%
17
AS5607
BSKYB
GB
13,714,642
546,089,615,156
12,821,973
93%
18
AS5089
NTL
GB
13,230,998
526,831,878,364
967
0%
19
AS9808
Guangdong Mobile
CN
59,428,828
470,319,744,792
17,133
0%
20
AS4766
Korea Telecom
KR
16,463,111
454,085,527,602
385,156
2%
Table 3 – Top 20 ISPs as valued by GDP per capita.
Another way to look at this data is by using a scatter plot, comparing the IPv6 deployment level on one axis and the aggregate value of the ISP’s customer base on the other. This comparison is shown for the same 20 ISPs in Figure 3.
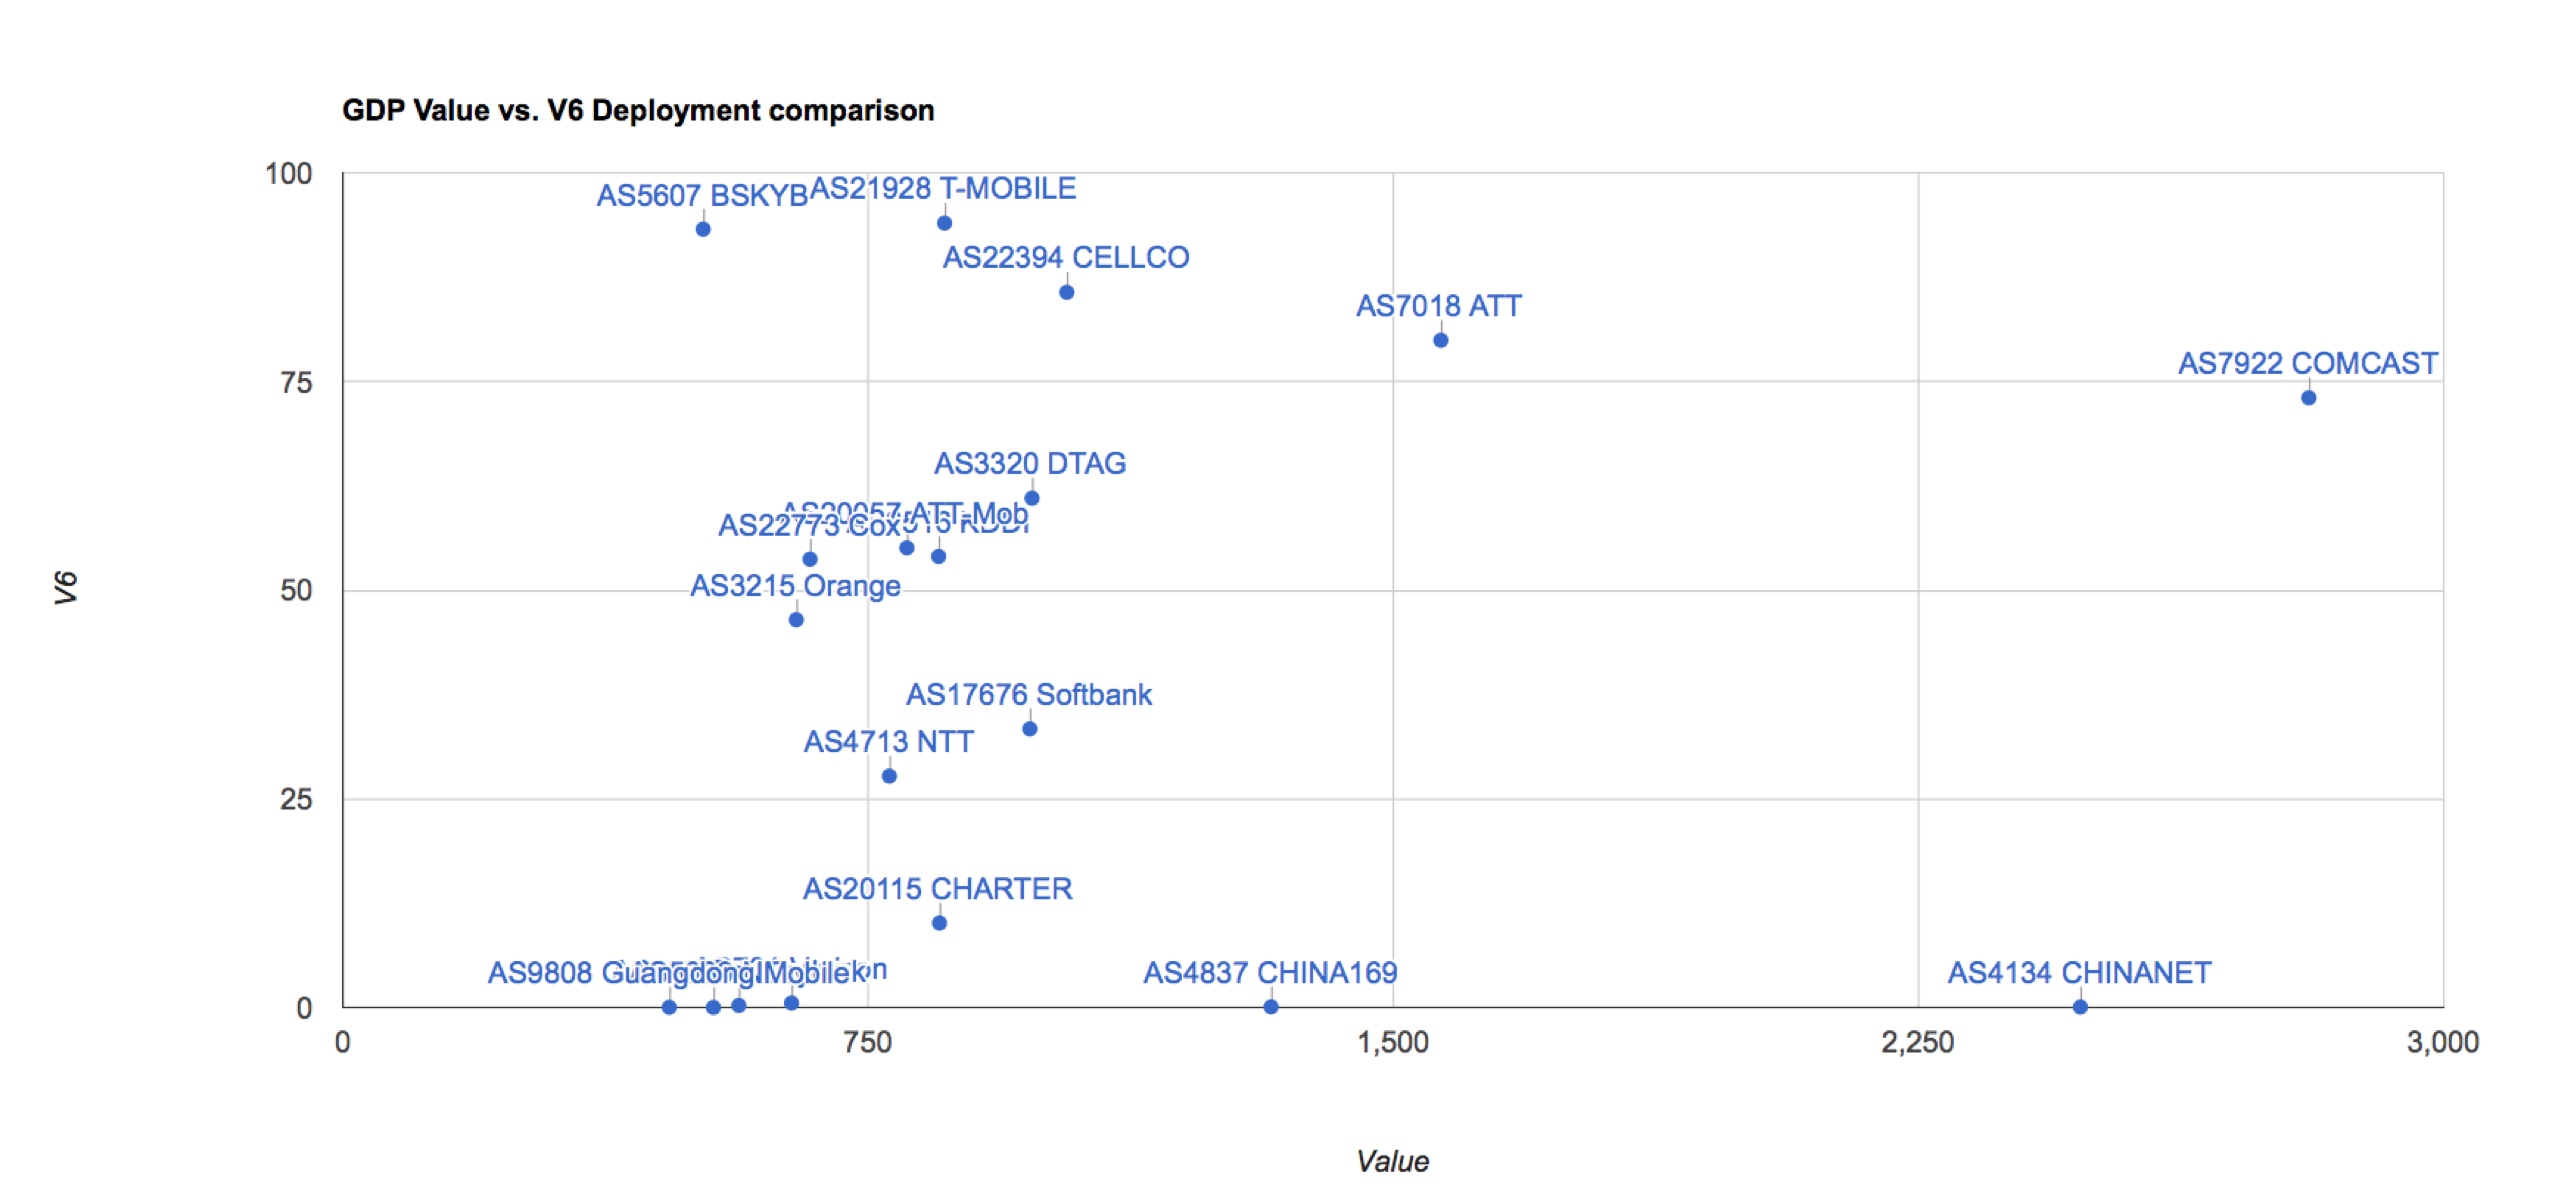
Figure 3 – IPv6 deployment vs ISP customer value for 20 richest ISPs.
If there were a clear relationship, then we should see a clustering of the data into some band where higher levels of notional value of the ISP would correlate with higher levels of IPv6 deployment. Clearly, no such clustering is evident in these numbers.
It is also the case that the 20 richest ISPs do not contain the majority of the IPv6 user population. Some of the larger IPv6 deployments, such as Reliance Jio in India and Claro in Brazil fall outside this top 20.
The top 20 richest ISPs only contain a little over one-quarter of the IPv6 user base, while the other three-quarters of the Internet’s IPv6 users are served from ISPs outside this same top 20 rich ISP list.
If we take the 400 highest value ISPs and perform the same comparison of value against IPv6 deployment, the correlation between the two metrics is shown in Figure 4.
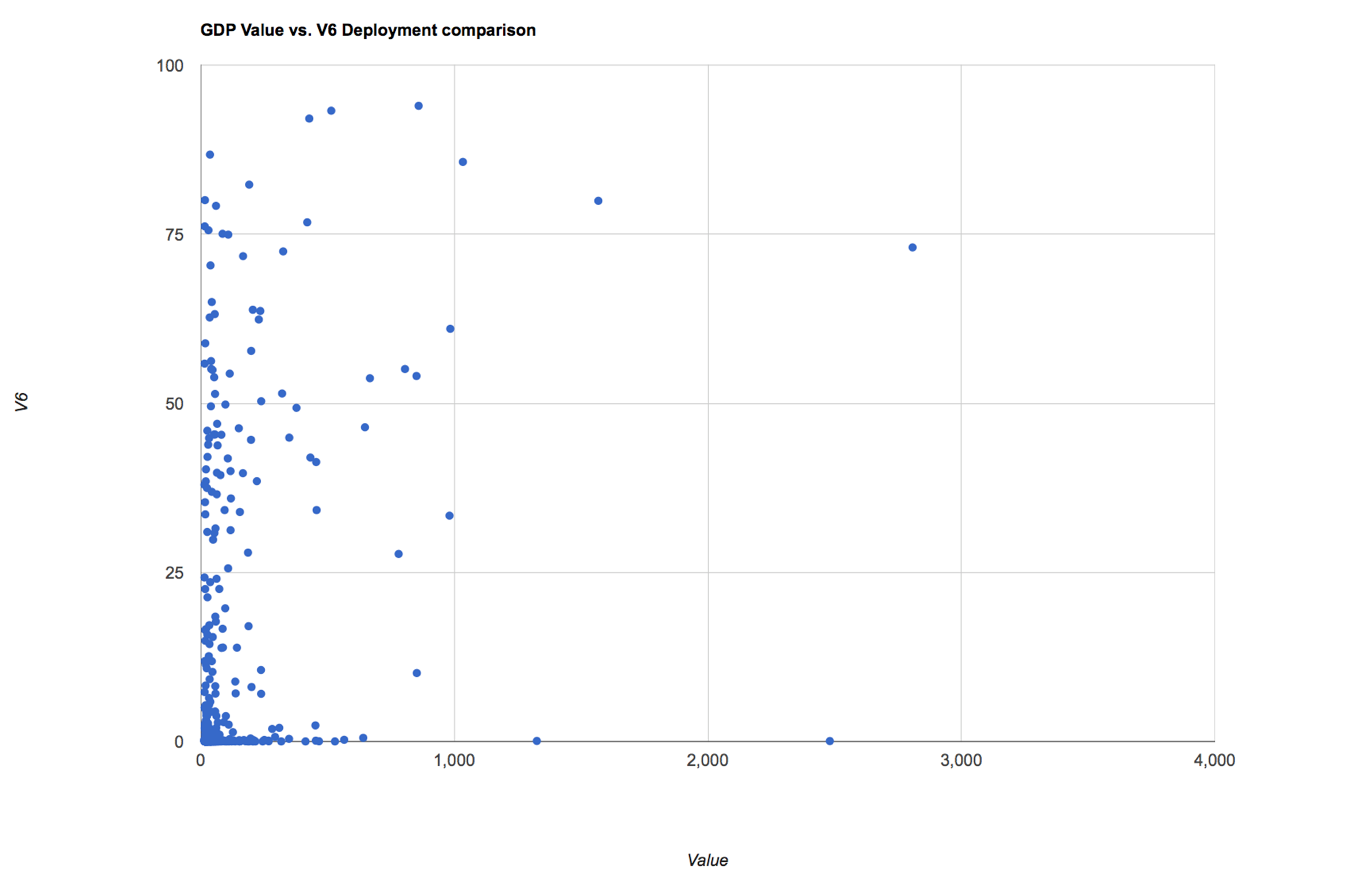
Figure 4 – IPv6 deployment vs ISP customer value for 400 richest ISPs.
Within this larger data set, there is still no clear correlation. And while having access to funding to deploy IPv6 is obviously an advantage, it is clear that ISPs that serve all profiles of user populations have decided to adopt IPv6.
It seems that the data is saying that you don’t necessarily need to be an ISP for a wealthy and large base of customers to afford to deploy IPv6. Being rich may well help to support the IPv6 business case, but it’s not a strict precondition here.
‘IPv6 is deployed when the ISP is growing rapidly’
Another potential motivation for IPv6 deployment is the scenario where the ISP is experiencing a rapid growth in customer numbers. In this scenario, it may be the case that the ISP has not made sufficient provision in its IPv4 holdings for this growth and needs to find a workable solution. Using the IPv4 address market to obtain additional IPv4 address is the obvious approach and many ISPs have used this market to obtain more IPv4 addresses, but the approach is not without its associated cost.
While IPv6 is not backwards compatible with IPv4 and is not directly substitutable for a lack of IPv4 addresses, IPv6 deployment can ease the pressure on an ISP’s IPv4 address pools. Dual-stack hosts on a dual-stack network typically use a ‘happy eyeballs’ approach, where an IPv6 connection is attempted first, and IPv4 is used only if the IPv6 connection does not complete in time. This means that a dual-stack deployment will push usage to IPv6 as long as the users access services from sites also using IPv6. A rapidly growing ISP may well see part of a response to such rapid growth in the deployment of IPv6. The Reliance Jio network appears to be a good example of this approach.
How general is this scenario? If we could identify those ISPs who are experiencing the largest growth levels in recent months would we see a strong correlation with that ISP’s adoption of IPv6? Table 4 shows the 20 large (more than 1 million customers) who have experienced the highest growth rates over the past 16 months.
Only seven of these rapidly expanding ISPs have an IPv6 deployment greater than 10%. Of these ISP who have deployed IPv6 to this level, all are expanding their IPv6 deployment at rates even greater than the underlying ISP growth rate. It appears to indicate that where an ISP has commenced an IPv6 deployment, growth in the underlying customer base is accompanied by an even faster growth in the IPv6 deployment levels. But at the same time where there is no initial IPv6 deployment, the rapid growth of an ISP’s customer base does not appear to act as an incentive for IPv6 deployment.
Rank
AS
AS Name
CC
Users (5/18)
Users (1/17)
Growth
V6%
V6 Growth
1
AS9644
SK Telecom
KR
6,846,142
1,521,612
350%
81%
55%
2
AS131445
Advance Wireless
TH
4,657,758
1,047,844
345%
42%
42%
3
AS37075
ZAIN UG
UG
3,776,883
1,021,996
270%
0%
0%
4
AS45271
Idea Cellular
IN
38,917,738
11,901,462
227%
39%
33%
5
AS9605
NTT DOCOMO
JP
5,840,898
1,826,417
220%
8%
8%
6
AS55836
Reliance Jio
IN
252,882,243
79,115,818
220%
92%
19%
7
AS56048
China Mobile
CN
4,632,749
1,479,558
213%
0%
0%
8
AS132061
Realmove
TH
3,033,271
1,035,635
193%
0%
0%
9
AS56041
China Mobile Zhejiang
CN
21,567,119
7,379,958
192%
0%
0%
10
AS38266
Vodafone Essar
IN
41,404,353
14,332,740
189%
40%
40%
11
AS21928
T-Mobile USA
US
15,522,746
5,725,701
171%
94%
17%
12
AS4761
INDOSAT
ID
7,750,603
2,889,955
168%
0%
0%
13
AS56047
China Mobile Hunan
CN
6,839,156
2,579,417
165%
0%
0%
14
AS10507
Sprint PCS
US
7,582,025
2,936,890
158%
77%
49%
15
AS24389
GrameenPhone
BD
5,202,927
2,018,349
158%
0%
0%
16
AS197207
MCCI
IR
7,451,173
2,897,240
157%
0%
0%
17
AS33771
SAFARICOM
KE
10,556,969
4,199,062
151%
2%
2%
18
AS23693
Telekomunikasi Selular
ID
15,027,678
6,043,987
149%
0%
0%
19
AS15897
VODAFONE TURKEY
TR
4,079,685
1,653,584
147%
0%
0%
20
AS5410
BOUYGTEL-ISP
FR
7,359,006
3,015,444
144%
2%
2%
Table 4 – Top 20 ISPs ranked by customer growth.
We can look at the correlation between the underlying growth in the customer base and the growth in IPv6 deployment for the 400 most rapidly growing ISPs (Figure 5).
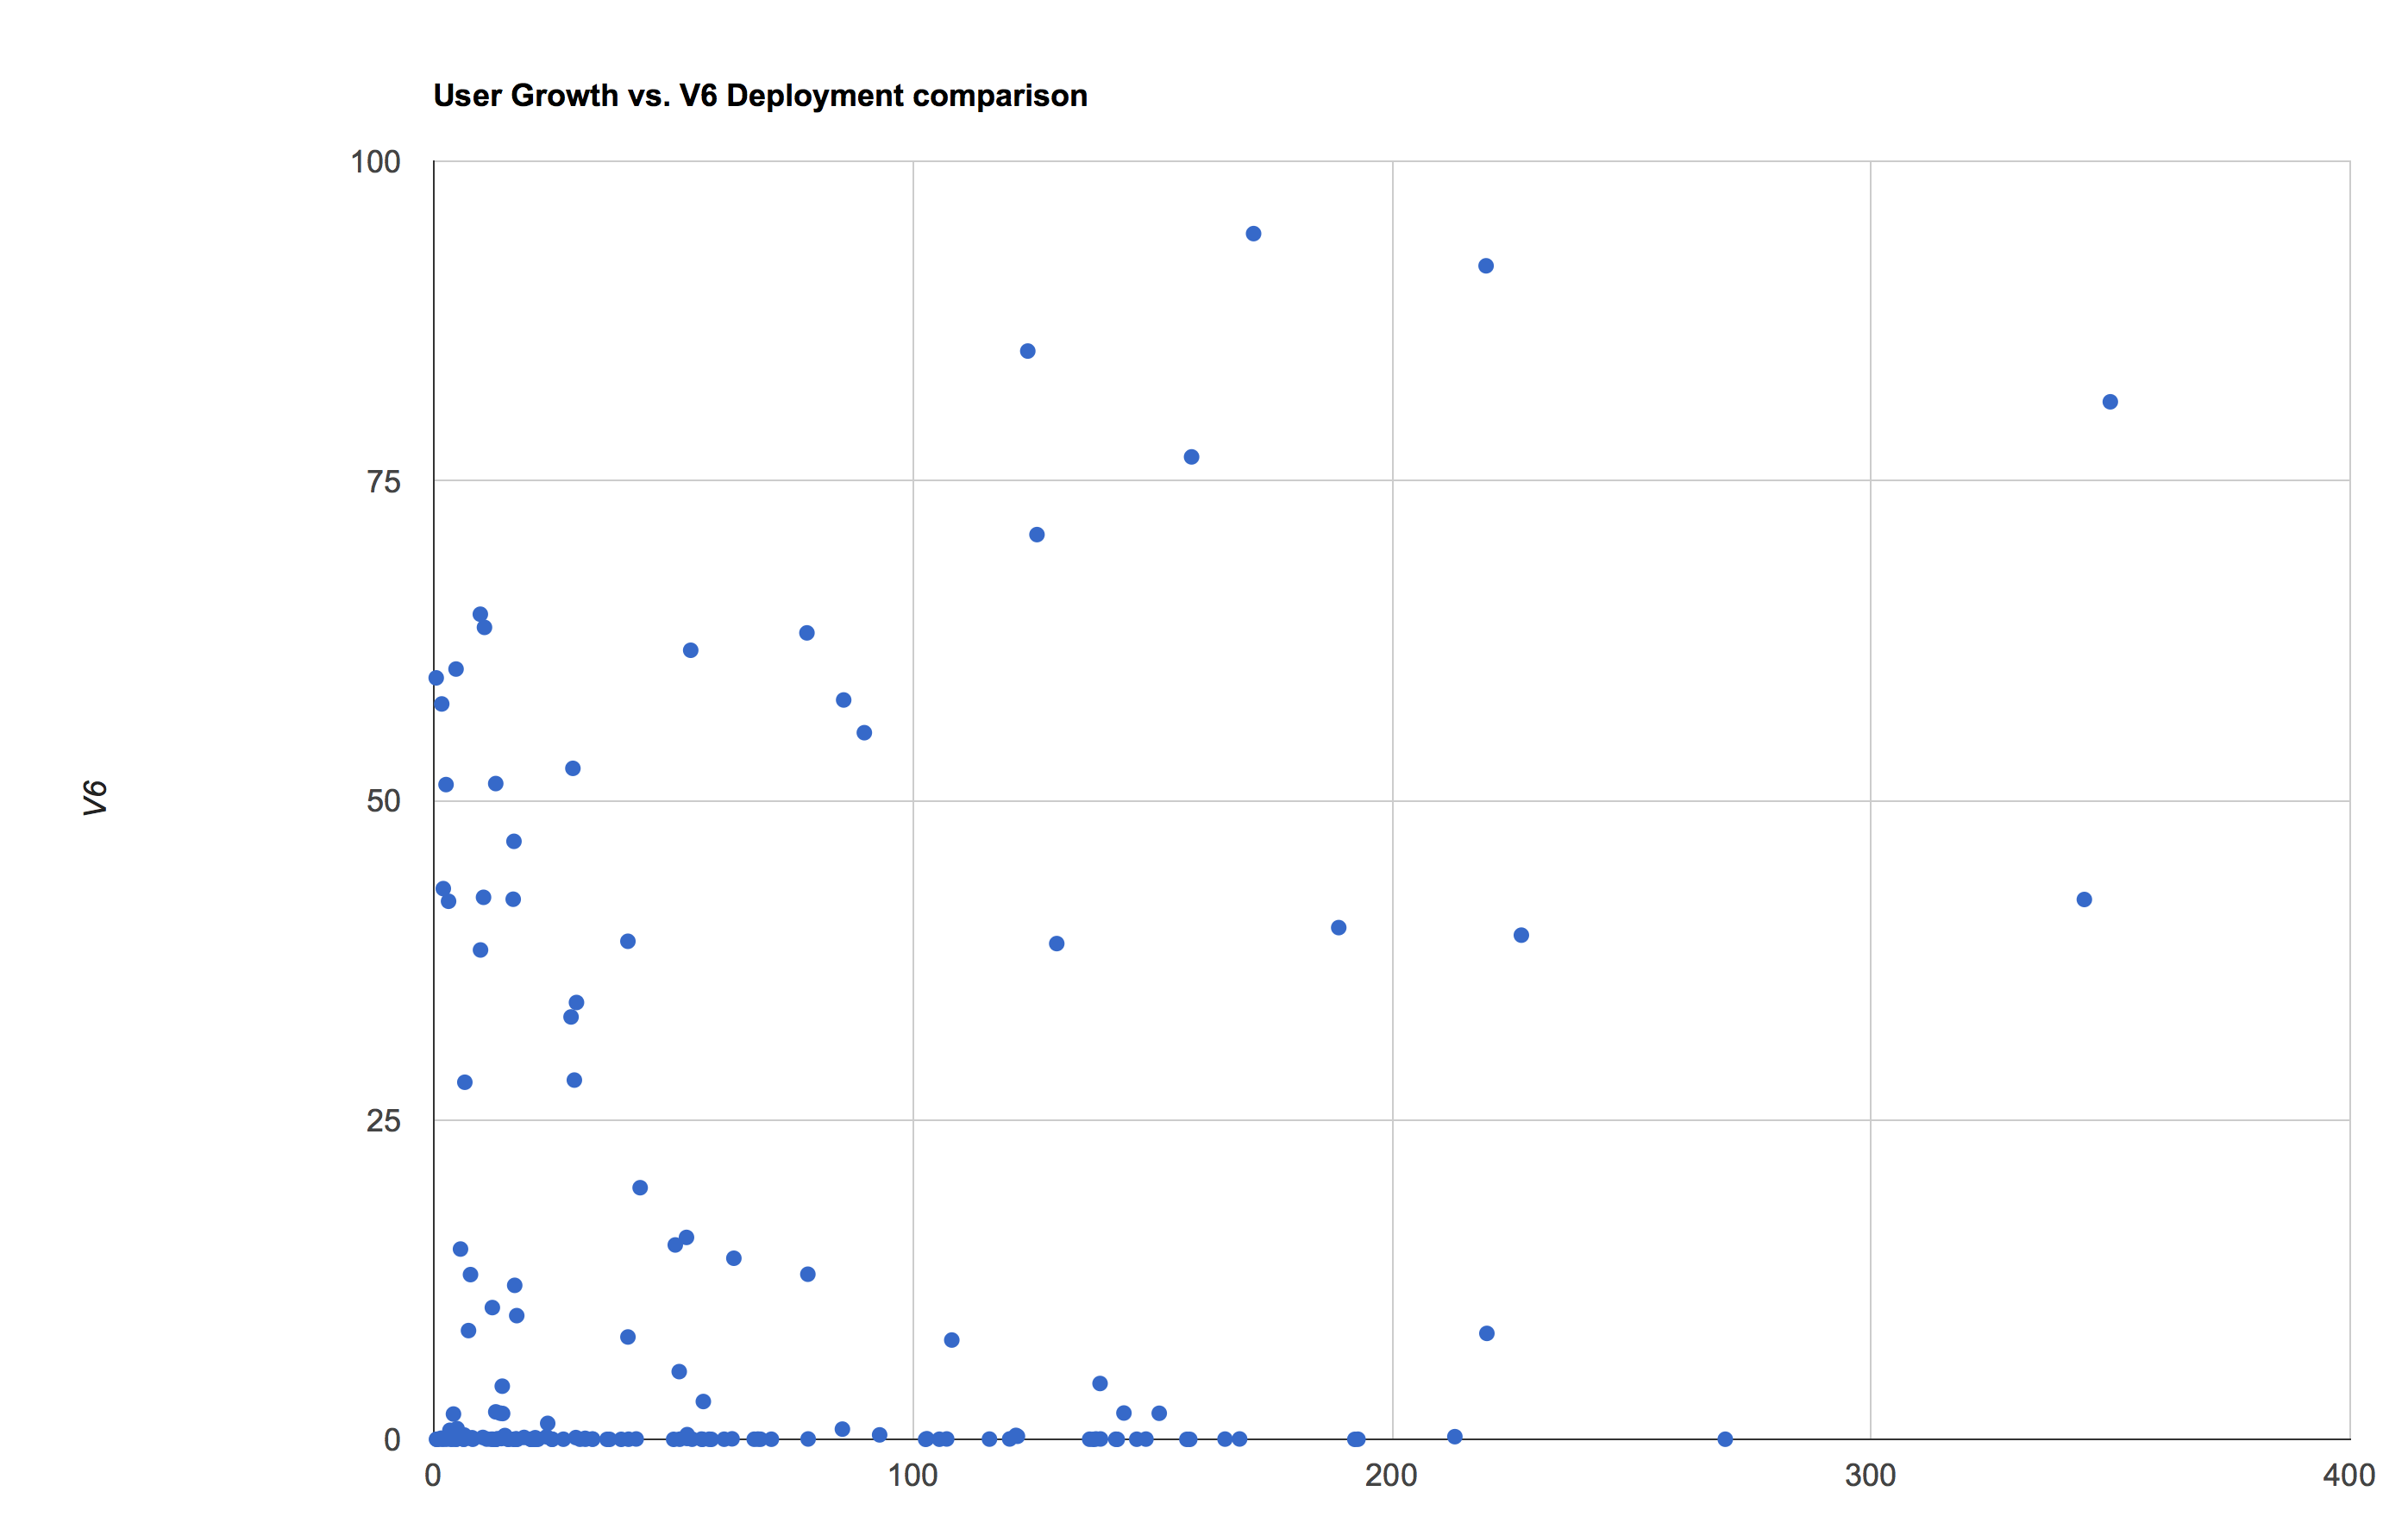
Figure 5 – IPv6 deployment vs ISP growth value for 400 growing ISPs.
Once more, there is no clear correlation going on here. One sub-group of ISPs with growth rates between 10% and 210% show IPv6 deployment levels that rise as the ISP growth rises (as shown by the blue group in Figure 5), but a second group shows a constant level of around 40% IPv6 deployment for all growth rates between 2% and 350% (orange group). The majority of the data points are in the band where IPv6 deployment is less than 20% and growth spans 2% through to 280% (green group).
Once more, we cannot substantiate this theory from the available data. A rapidly expanding ISPs does not necessarily deploy IPv6 as a response to this rapid growth. Some ISPs do, but many others do not.
‘IPv6 is deployed when an ISP runs out of IPv4 addresses’
The development of the IPv6 protocol was a response to the projection of IPv4 address exhaustion. The rationale was that an operator would be strongly motivated to deploy IPv6 in order to avoid many of the issues of attempting to operate an IP service with insufficient IP addresses.
If this is the case, then we should be able to look at each ISP and estimate their level of IPv4 address scarcity and observe that those ISPs with the greatest level of address scarcity pressure also show substantial deployment of IPv6.
Table 4 shows the Internet’s 20 largest ISPs as measured by the estimated size of their customer base. For each of these ISPs, we’ve compared the number of users to the total span of advertised IPv4 addresses that are announced by this ISP. This gives us a notional value of the number of users for each visible public IPv4 address. The largest values — indicating the most extreme levels of IPv4 public address scarcity — are seen in Nigeria, and the largest ISP in that country has the ratio of 402 customers per public IPv4 address. Three of the Indian ISPs have ratios of 66 or greater.
The question is whether the higher the ratio of customers for each IPv4 address relates to deployment of IPv6 in that ISP? There are 10 ISPs in this list with an IPv6 deployment level of above 10%, but the address use ratios of these 10 vary from 0.34 (or three addresses per customer) to 70 customers per IP address.
Rank
AS
AS Name
CC
Users (est)
IPv4 Addrs
IPv4 Ratio
IPv6%
1
AS4134
ChinaNET
CN
309,309,607
108,180,224
2.86
0%
2
AS55836
Reliance Jio
IN
252,882,243
3,593,728
70.37
92%
3
AS4837
China Unicom
CN
157,000,163
56,262,655
2.79
0%
4
AS45609
Bharti Airtel
IN
70,522,541
3,968,000
17.77
4%
5
AS9808
Guangdong Mobile
CN
61,231,552
18,678,528
3.28
0%
6
AS7922
Comcast
US
48,758,165
71,069,952
0.69
73%
7
AS38266
Vodafone Essar
IN
41,404,353
601,344
68.85
40%
8
AS45271
Idea Cellular
IN
38,917,738
584,448
66.59
39%
9
AS4812
China Telecom
CN
35,767,235
8,605,952
4.16
0%
10
AS29465
VCG-AS
NG
32,523,737
80,896
402.04
0%
11
AS8151
Uninet S.A. de C.V.
MX
29,853,671
13,798,112
2.16
11%
12
AS4808
China Unicom Beijing
CN
28,340,473
6,860,287
4.13
0%
13
AS7018
ATT
US
27,078,307
80,679,680
0.34
79%
14
AS17676
Softbank BB
JP
25,227,427
44,918,528
0.56
33%
15
AS28573
CLARO S.A.
BR
24,281,752
9,138,176
2.66
47%
16
AS3320
Deutsche Telekom
DE
23,467,950
34,140,416
0.69
60%
17
AS8452
Telecom Egypt
EG
23,396,481
7,063,040
3.31
0%
18
AS9121
Turk Telecom
TR
22,621,162
6,905,600
3.28
0%
19
AS2516
KDDI
JP
22,149,880
18,765,568
1.18
53%
20
AS56041
China Mobile Zhejiang
CN
21,567,119
2,939,904
7.34
0%
Table 5 – Top 20 ISPs ranked by estimated customer size, and IPv4 use ratio.
The table does not show a clear correlation, but once more we can take the largest 400 ISPs and use a scatter plot to match their IPv4 ‘use ratio’ (the number of customers per advertised IPv4 address) to the IPv6 deployment level. This is shown in Figure 6.
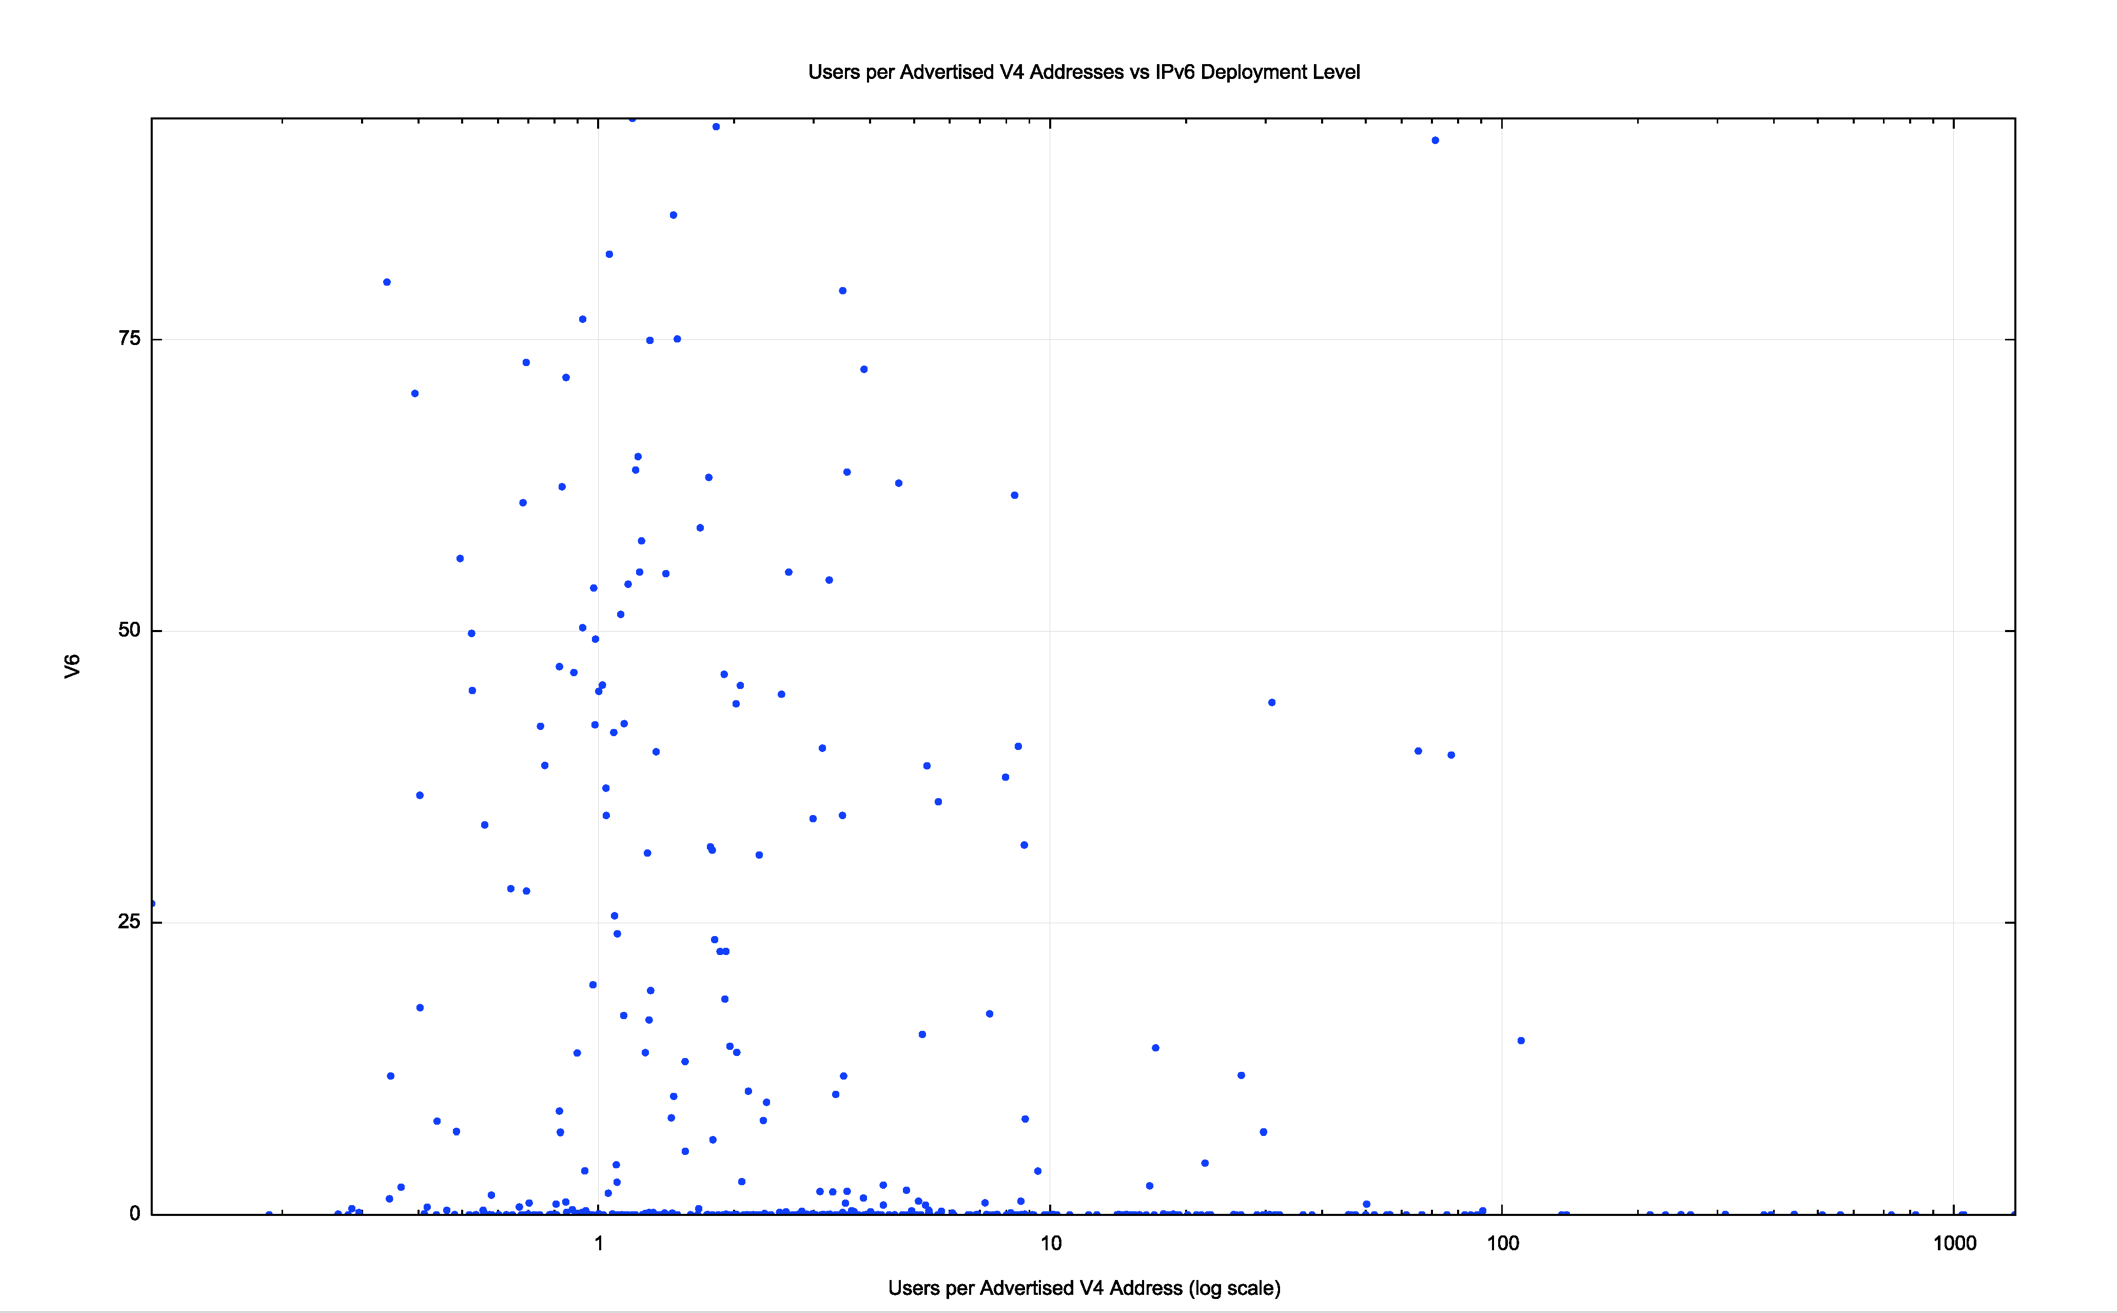
Figure 6 – IPv6 deployment vs IPv4 address use.
Most of these ISPs have IPv4 address use ratios of between 0.5 (or, inversely, 2 addresses per estimated customer) and 10 (that is, 10 customers per advertised IP address). However, there is no visible relationship between this IPv4 address use ratio and IPv6 deployment. The highest customer to IPv4 address ratios are in excess of 800 — experienced by a number of ISPs in Nigeria — yet there is no visible level of IPv6 deployment in those ISPs as yet.
This is perhaps the most surprising result. The motivation behind the timing of the development of the IPv6 protocol was to have a mature and well-understood technology platform long before we ran down the levels of IPv4 to the extent that not only are the pools completely exhausted but instead of deploying IPv6, many ISPs are deploying address sharing technologies.
There are good reasons why many ISPs have taken this path as a short-term business response. For many ISPs an investment in IPv6 does not offer immediate benefits to the ISP customer base. It does not reduce the ISP’s cost base, and if development funds are finite it is not unsurprising that many ISPs have chosen to concentrate on activities that offer direct outcomes, such as 5G in the mobile sector, or securing content arrangements in the broadband service sector.
IPv6 is often seen as a risk mitigation measure, and while address sharing technologies are capable of deferring the problem, IPv6 is not screaming for an operator’s attention in many cases. However, perceptions of risk can be very subjective, and while some ISPs are comfortable with deferring IPv6 deployment, others have already taken steps.
The salient observation here is that the level of address shortage being experienced by an ISP does not appear to have a strong influence on the perception of risk of a collapse of the IPv4 Internet.
‘IPv6 is deployed when an ISP’s competitors deploy IPv6’
The early days of the outreach of the Internet from the academic and research sector were seen as wild days! The industry was driven by entrepreneurs who saw a unique opportunity in challenging the entrenched monopoly of the telephone companies. The catch-cry of the time was innovation and a deliberate effort to distinguish these new entrants as being completely different from the ponderous conservatism of the telephone industry.
Inevitably, size creates inertia, and as the customer base of these service providers expanded their ability to move quickly was significantly reduced. The Internet business sector now shows behaviours that have much in common with the old telephone sector. One of the common characteristics in this form of environment is that the dominant operators in a market tend to act in similar ways, offering similar services and at similar prices to their customers.
What happens when one of the larger service providers in a market offers a new service? It is often the case that this provides sufficient impetus for other providers in the same market to offer the same service.
Does this same behaviour apply to IPv6? How many national markets exist where three or more of the six largest ISPs have an IPv6 deployment of 20% or more? The list is surprisingly small, as shown in Table 6.
Economy
IPv6
India
58%
Belgium
58%
USA
44%
Germany
39%
Greece
38%
Japan
27%
Brazil
26%
Table 6 – Countries with combined IPv6 deployment.
The other more populous economies with a significant level of IPv6 deployment only have two or one of the largest six ISPs providing IPv6 services to their customers.
Does this small list of economies in Table 6 prove or disprove the theory that competitive pressures tend to push other ISPs to deploy IPv6 once IPv6 deployment has commenced in an economy? It’s hard to say.
What drives IPv6 deployment?
What can we observe about the drivers for deployment of IPv6 in 2018?
-
You don’t have to be rich, but it helps.
-
You don’t have to be growing rapidly, but at times rapid growth provides sufficient grounds to make the move.
-
You don’t have to be desperately short of IPv4 addresses, but again it may help.
-
You can do it by yourself, but it can help when your competitors do it as well.
When the IPv6 protocol was first designed, we thought of the Internet in the same terms as the telephone network — as a peer network. Every connected device was meant to be able to both initiate transactions and respond to transaction requests. Addresses were both a network locator and a persistent endpoint identifier. When we were projected to run out of IPv4 addresses the consequence was that the network could no longer admit more endpoints.
That was then. Today is very different. These days, it’s a client-server network. Clients do not need a persistent network-wide identity and only need addresses as and when they communicate with servers. Servers do not need persistent identity either these days, as the identity of a server is a name-based distinguisher rather than an address-based identifier.
We have positioned IP addresses in a different role, and no longer need to associate a unique public IP address with every connected endpoint. Address sharing technologies have allowed us to grow the pool of connected devices far beyond the number of unique addresses in the protocol.
How far can this client/server model grow while relying on IPv4?
How many devices can we cram into the IPv4 Internet before we break it?
Perhaps that’s a question we should not want to answer from experience.
This article was originally published on the APNIC blog.
Any views, positions, statements or opinions of a guest blog post are those of the author alone and do not represent those of ARIN. ARIN does not guarantee the accuracy, completeness or validity of any claims or statements, nor shall ARIN be liable for any representations, omissions or errors contained in a guest blog post.
OUT OF DATE?
Here in the Vault, information is published in its final form and then not changed or updated. As a result, some content, specifically links to other pages and other references, may be out-of-date or no longer available.